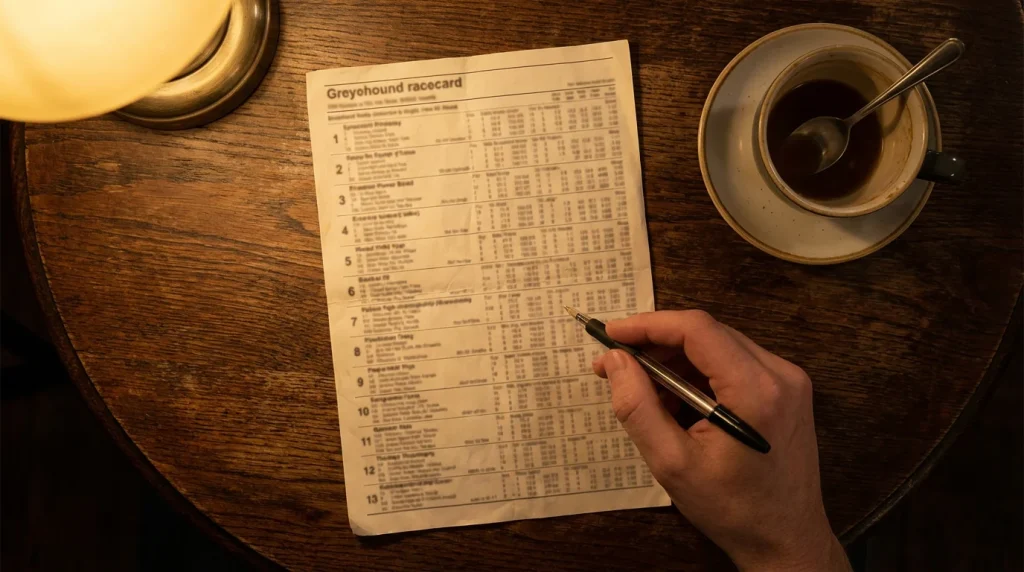
How to Read Greyhound Racecards & Form Figures: The Complete UK Guide
The Racecard Isn’t Decoration — It’s Your Pre-Race Briefing
Most people scan the trap number and the price. That’s maybe 10% of what’s there. The rest — form figures, calculated times, grade history, trainer, weight, season status — sits right in front of them, free of charge, packed with information that directly affects the outcome of the race. And they skip it. Get more form guides at dogracingfastresults.
A UK greyhound racecard is standardised across every GBGB-licensed track. Whether you’re looking at a Monday afternoon BAGS meeting from Crayford or a Saturday night feature card at Nottingham, the format is essentially the same. That’s a significant advantage over horse racing, where card layouts vary between publishers and information is scattered across multiple sources. In greyhound racing, one card gives you the lot.
The racecard is where preparation happens. It tells you how each dog has performed recently, what traps it’s drawn from before, how its times compare to the opposition, and whether it’s moving up or down in grade. None of this is hidden or paywalled — it’s published hours before the first race and freely available from sources like Sporting Life, Timeform, and the Racing Post. The information asymmetry in greyhound racing doesn’t come from access. It comes from interpretation.
This guide breaks the card open. Every element, every abbreviation, every data point — explained in the order you’ll encounter them, with practical context about what actually matters when you’re trying to separate six dogs wearing coloured jackets running the same distance at the same track on the same night. If you can read a racecard properly, you’re already working with more information than most of the money in the market.
Anatomy of a UK Greyhound Racecard
Let’s take it apart, box by box. A standard UK greyhound racecard presents six runners — one per trap — with a consistent set of data fields for each. The layout reads left to right, top to bottom, and once you know the structure, you can scan a full six-dog race in under two minutes. Here’s what you’re looking at.
At the top level, you’ll see the race header: the race number, race time, track name, distance in metres, and the race grade (e.g. A3, OR, S2). This immediately tells you the competitive standard, the distance category, and when the race is scheduled. Below that, each runner gets a row or block containing the following fields: trap number and jacket colour, dog name, trainer name, form figures (the last six runs), weight, age, colour and sex, best recent time at the distance, predicted or calculated time, grade history, and a race comment or sectional note from the most recent outing.
Some card providers add extra columns — Timeform includes their own ratings, the Racing Post adds analyst comments — but the core data is universal. Every GBGB-licensed track submits race data to the same central database, which is why the format doesn’t change much regardless of where you’re looking. The consistency is the feature. Once you’ve learned to read a card from Romford, you can read one from Sunderland without relearning anything.
The most common mistake new bettors make is treating the racecard like a fixture list — something to glance at for names and prices. In reality, it’s a compressed dataset. Each field connects to the others, and the value is in reading them together rather than in isolation. A dog’s form figures mean more when you cross-reference them with its grade movements. A run time means more when you check the calculated time adjusted for track conditions. The racecard rewards the kind of attention that most punters are too impatient to give it.
Dog Details: Name, Trainer, Colour, Weight
The trainer line is the first clue most people ignore. Every greyhound on a UK racecard is listed with its trainer’s name, and this matters more than casual bettors realise. Trainers at GBGB-licensed tracks operate kennels that handle multiple dogs, and kennel form — the overall strike rate and recent performance of dogs from the same yard — is a genuine signal. A trainer whose dogs have been running well across multiple meetings is often worth monitoring, even if the individual dog doesn’t have standout form. Conversely, a kennel going through a cold spell might suggest underlying issues that affect every runner they put forward.
Weight is listed in kilograms and typically ranges from around 26kg for smaller bitches up to 36kg or more for big-framed dogs. Weight on its own tells you very little. Weight change between runs tells you quite a lot. A dog that has gained a kilogram since its last race might be carrying extra condition, which can slow it down. A dog that has lost weight might be fitter, or it might be stressed. The key is the trend rather than the absolute number. Most racecard providers show the current weight alongside the weight at the dog’s last run, making the comparison straightforward.
Colour and sex are listed using standard abbreviations: bd (black dog), bk d (brindle dog), wbk b (white-and-brindle bitch), and so on. Sex matters specifically for bitches because of the season indicator — a bitch coming back from a season break (usually around three months) can be unreliable on her first few runs back. Some cards flag this with an “s” next to the form figures. If you see that marker, factor in the possibility that the dog hasn’t hit full racing fitness yet.
Grade & Class: Where This Dog Sits in the Hierarchy
Grade is the dog’s league table position. UK greyhound racing uses a grading system that runs from A1 (the highest at most tracks) down to A11, with each grade representing a performance band. Dogs are graded by the racing manager at each track based on their recent winning times, and they move up or down the ladder depending on results. Win a couple of races in A5, and you’ll likely get promoted to A4 or A3. Lose your form, and you’ll slide down.
The grade shown on the racecard tells you two things: the current competitive level of the race and, by extension, the quality of opposition the dog is facing. A dog graded A3 racing in an A3 contest is at its natural level. A dog that was recently A2 but has been dropped to A4 might be facing weaker opposition than it’s used to — a potential edge. A dog rising from A6 to A4 after a couple of wins might be hitting a ceiling. Grade movements are listed on the card, and reading them is one of the most underrated aspects of racecard analysis.
Beyond the numbered grades, you’ll encounter OR (open race), which sits above the regular grading structure and features the strongest dogs at a track. There’s also S (sprint) for shorter distance events, M for marathon or staying races, and specific puppy grades for younger dogs. The abbreviation next to the grade tells you the distance category, so A3 480 means a graded A3 race over 480 metres. Check the grade, check the direction of travel, and you’ve already filtered the field before looking at a single form figure.
Decoding Form Figures: The Six-Run Snapshot
Read right to left. The freshest form is on the right. That’s the convention in UK greyhound racing, and it catches people out if they’re coming from horse racing where the most recent run is typically listed first on the left. A form line of 3 5 1 2 4 1 means the dog finished third six runs ago, fifth five runs ago, and — reading to the right — first in its most recent outing. The last two or three figures carry the most weight because they reflect current form, fitness, and likely grading.
The numbers 1 through 6 represent finishing positions, matching the six traps in a standard race. A 1 is a win. A 6 means the dog came last. But there are several other characters that appear in form lines, each carrying specific meaning. An “0” (sometimes rendered as “O”) indicates the dog failed to finish or was disqualified. An “m” signals the dog was moved up after a stewards’ inquiry — it didn’t cross the line in that position but was awarded it afterwards. An “F” means the dog fell during the race. A “T” can indicate a trial, not a competitive race.
The pattern matters more than any individual figure. A form line of 1 1 2 1 1 1 tells an obvious story — this dog wins regularly and is presumably well-graded or about to be promoted. A line of 6 5 4 3 2 1 shows consistent improvement, which is exactly the trend you want to see: a dog finding its form and coming right. A line of 1 1 1 5 6 5 is the opposite trajectory — a dog that was winning but has now lost its way, possibly through injury, grade promotion, or loss of form. Context is everything, and this is where cross-referencing with other racecard data becomes essential.
Six runs is the standard window that most racecards display, but not every dog will have six runs on its record. A younger dog might show only two or three figures, which makes each one more significant and less reliable at the same time. Some cards include a wider career summary, but for day-to-day betting purposes, the six-run form line is the standard tool. Treat it as a compressed biography: it doesn’t tell you everything, but it tells you where the story has been heading.
One thing to watch: form figures don’t account for the trap drawn, the track raced at, or the distance. A dog that finished fourth from trap 6 at a track with a strong inside-rail bias might have run a significantly better race than the bare figure suggests. This is why form figures are the starting point, not the conclusion. Always check the supporting detail before deciding what a number really means.
Traps, Bumping Codes & Race Comments
A second-place finish means nothing without the comment line. That’s not an exaggeration — race comments transform raw form figures into actual information. Every graded race generates a brief running comment for each dog, recorded by the race judge, and these comments appear on the racecard for the next run. Common shorthand includes: “Led” (led the field), “EP” or “EarlyPace” (showed early speed), “Crd” (crowded or checked during running), “Wide” (raced wide, losing ground), “RanOn” (finished strongly), “SAw” (slow away from traps), “Bmp” (bumped by another runner), and “Mid” or “Rls” (middle or rails running position).
These comments tell you how the race unfolded from that dog’s perspective. A dog that finished third but was “Crd3” (crowded at the third bend) might have been capable of winning without the interference. A dog that “Led-2” (led until the second bend, then weakened) probably doesn’t stay the distance. A dog that was “SAw” (slow away) and still finished second has more potential than one that “Led” and still only managed second.
Bumping codes are particularly important. Greyhound racing involves six dogs running in close proximity at high speed around bends, so interference is common. If a dog’s form shows repeated “Crd” or “Bmp” comments, you need to assess whether it’s unlucky or whether it’s habitually poor at negotiating traffic. Some dogs are consistently involved in scrimmaging; others rarely are. The comment line tells you which type you’re dealing with.
Cross-referencing the trap number with the comment also reveals spatial patterns. A dog that shows “Wide” from trap 1 has a running style problem — it should be hugging the rail from that box but instead drifts out. A dog that shows “Crd” repeatedly from traps 3 and 4 might simply be getting caught in the pack on the first bend, which is the most congested part of any race. Traps, comments, and finishing positions together create a picture that form figures alone never provide.
Run Times & Calculated Times: Speed on Paper
Two dogs ran 28.50. One was faster. That’s not a riddle — it’s the reason calculated times exist. An actual run time is the clock time from traps opening to the first dog crossing the line. Every dog in the race is then timed relative to the winner, with distances beaten converted into time. So a dog finishing two lengths behind a winner that ran 28.50 might be recorded at 28.64. These are raw, unmodified numbers.
The problem with raw times is that they don’t account for race conditions. Track surfaces vary from meeting to meeting depending on weather, maintenance, and sand depth. A 28.50 on a fast-running night might be the equivalent of 28.30 on a slower surface. If you compare raw times from different meetings without adjusting for conditions, you’re comparing different measuring sticks. This is where calculated time — sometimes called adjusted time or standard time — comes in.
Calculated time applies a track variant to adjust each dog’s raw time to a standard baseline. The variant is determined by comparing the overall times from a meeting against historical averages for that track and distance. If a meeting runs 0.20 seconds slow across the board, each dog’s time is adjusted downward by that amount. The result is a time that can be compared meaningfully across different meetings, different conditions, and even different tracks running the same distance.
Not every racecard provider shows calculated times. Timeform does. The Racing Post includes them in its detailed form. Many free racecard sources show only raw times, which limits your ability to compare runners accurately. If you’re serious about using time as a selection factor — and you should be, because it’s one of the most objective measures available — seek out a source that publishes calculated times. The effort of checking a second source is trivial compared to the advantage it gives you.
A practical tip: focus on calculated times over the distance the race is being run. A dog with a strong 480m calculated time might be mediocre over 265m, and vice versa. Sprinters and stayers are fundamentally different athletes, and times only make sense within the same distance category. Also be cautious about times set more than four to six weeks ago — greyhound form changes quickly, and an impressive time from two months back might belong to a different dog in practical terms.
Putting It Together: A Racecard Analysis Walkthrough
Theory’s done. Here’s a card. Work it. Imagine a six-dog A4 race over 480 metres at Romford on an evening card. The trap draw is set, the racecards are published two hours before the first race, and you’ve got six runners to assess. Let’s walk through the process rather than stare at fields in isolation.
Start with grade context. This is an A4, which at Romford sits in the middle of the grading spectrum. Check whether any runner has been recently promoted or demoted. If trap 3 was racing in A2 three runs ago and has dropped to A4 after a couple of poor results, that’s a dog facing weaker opposition than it recently competed against. Its form figures might look modest — maybe 4 5 6 from the A2 races — but the class drop gives it a latent advantage. Conversely, if trap 5 has risen from A6 to A4 on the back of two wins, it might be hitting a level where the competition stops it.
Next, check the form figures and race comments together. Don’t just look at positions — look at why. If trap 1 shows 2 1 1 with comments of “Led” and “EP,Led” (early pace, led throughout), that’s a front-runner with a clear racing style. From trap 1 at Romford, where the first bend comes quickly and inside runners get a natural rail advantage, that running style matches the trap draw. Good sign. If trap 6 shows 1 2 1 but the comments are “RanOn” and “MidTrk,RanOn” (ran on from mid-track), this dog is a closer that needs room to operate. Trap 6 at Romford is the widest draw, which gives room but adds extra ground on the bends. That’s a trade-off worth assessing.
Now overlay the times. Check calculated times over 480m for each runner. If trap 1 has a best calculated time of 28.95 and trap 4 has 28.78, the difference is less than two-tenths of a second — roughly a length. That’s close enough that other factors (trap, early speed, racing luck) could easily swing the outcome. If one dog has a calculated time a full half-second faster than the field, you’re looking at a class edge that the numbers support.
Finally, look at weight trends and trainer form. Has any dog gained or lost more than half a kilogram since its last run? Is any trainer sending two dogs to the same meeting, and has that kennel been in good form? These are secondary factors, but in a competitive A4 race where two or three dogs look similar on primary data, the secondary detail can tilt the assessment.
The walkthrough doesn’t produce a guaranteed winner — nothing does, particularly in a sport where six dogs chase a mechanical hare around bends at forty miles per hour. What it does produce is a structured opinion, backed by data, that separates runners you’d consider from runners you wouldn’t. That’s the practical value of reading a racecard properly: not certainty, but informed judgment.
Common Racecard Mistakes Bettors Make
The mistake isn’t missing a winner — it’s not asking why you missed it. And more often than not, the answer is somewhere on the racecard, in a field that didn’t get enough attention. Here are the errors that show up most frequently among greyhound bettors, from beginners through to experienced punters who should know better.
Over-valuing the last run. The most recent form figure carries psychological weight far beyond its statistical significance. A dog that won last time out looks appealing. But if that win came in a lower grade, from a favourable trap, on a fast track, and tonight it’s drawn trap 6 in a higher grade on a different surface — the relevance of that last run drops sharply. One result is an anecdote. The last three or four results, read together, are evidence.
Ignoring weight changes. A kilogram swing between runs is significant for a greyhound. It might indicate a change in fitness, health, or condition. Most bettors barely glance at the weight column, but those who track changes over consecutive runs often spot dogs coming into or out of peak condition before the market adjusts.
Not checking trap history at the specific track. A dog might have strong form in general, but if it’s never won from trap 5 at Romford — a track where that draw can be awkward on the first bend — the racecard is flagging a potential problem. Many racecard providers include a line showing the dog’s record from each trap. Use it.
Treating grade changes as neutral. When a dog drops a grade, the field it faces is objectively weaker. When it rises, the opposition gets tougher. Yet many bettors price a dog based on its finishing positions without adjusting for the grade in which those positions were achieved. A dog that finished third in A2 three times running might well be the class act in tonight’s A4 contest. The form figures look mediocre; the context says otherwise.
Skipping the race comment. If you read only the form figures and not the comments, you’re reading a headline without the article. The comment tells you whether a poor finish was the dog’s fault, bad luck, or the result of a crowded first bend. It takes ten seconds per dog. Those ten seconds are often the difference between a lazy selection and an informed one.
Beyond the Card: What the Racecard Doesn’t Tell You
The racecard shows you what happened. Not what’s about to. For all its density and usefulness, the racecard has genuine blind spots — areas where the data either doesn’t exist in printed form or is deliberately absent. Understanding these gaps is part of reading the card effectively, because knowing where the information ends tells you where your own judgment has to start.
Kennel confidence isn’t on the card. Trainers know more about their dogs than any racecard can convey. A dog might look average on paper but be thriving in the kennel — eating well, training sharply, responding to a change in routine. Conversely, a dog with strong recent form might be carrying a niggle that isn’t serious enough for withdrawal but enough to blunt its performance. None of this is published. Trackside regulars, who watch the dogs in the paddock before a race, sometimes pick up signals — a dog that looks lean and eager versus one that looks flat or distracted. These aren’t data points. They’re observations, and they complement racecard analysis rather than replacing it.
Trial form is another gap. Greyhounds regularly have trial runs at tracks — timed sessions that don’t count as competitive races and don’t appear in form figures. A dog returning from injury or a bitch coming back from season will often have one or two trials to sharpen up before entering a graded race. Some trainers mention trial times in press comments, and certain specialist sites track them, but they’re not on the standard racecard. A dog showing only two form figures might have had three or four strong trials that suggest it’s fitter than its limited race record implies.
Race-night behaviour — how a dog acts in the traps, how it responds to the hare, how it handles the first bend under pressure — is experience-based knowledge. A dog that’s known to be a slow trapper will show “SAw” in its comments, but there’s a difference between a dog that’s routinely half a length slow and one that occasionally misses the break entirely. The racecard gives you the abbreviation. The knowledge comes from watching the dog run.
None of this makes the racecard less valuable. It makes it exactly what it is: the best available starting point for assessing a race, with room above it for bettors who go further.
The Dog Behind the Data
Numbers don’t run. Dogs do. A racecard can tell you that a greyhound has won three of its last five races, runs 29.10 calculated over 480 metres, has dropped a grade, and is drawn in a favourable trap. It can’t tell you that the dog catches the hare with a conviction that makes the rest of the field irrelevant, or that it fades in the final fifty metres whenever the pace is genuinely contested. Also read our reading form guide.
The best bettors in greyhound racing combine both. They use the racecard as the foundation — filtering the field by time, form, grade, and trap — and then layer on observation, track knowledge, and pattern recognition. The card narrows the options. Judgment makes the call. Neither works well without the other, and the punters who consistently find value are the ones who treat the racecard as a tool with known limits rather than an oracle with all the answers.
Learn the card. Read every field. Understand what each symbol means and how each data point connects to the others. Then watch the race, compare what happened to what the card predicted, and refine your reading next time. The racecard isn’t a shortcut to winners. It’s the discipline that makes finding them possible.